Elbridge Gerry, one of our nation’s founders, had a long and some would say checkered career as a politician. He signed the Declaration of Independence, but refused to sign the Constitution. He flip-flopped political parties and lost four races for Governor of Massachusetts before finally being elected in 1810. After two men declined James Madison’s offers to run as his vice-president, Gerry agreed as third choice. He died less than two years after they had won the White House.
During his one term in office as Governor, Gerry used his power to sign a law that redrew state senate districts in a way that favored his political party, the Democratic-Republicans. The tactic worked to staggering effect. In 1812, Gerry lost his reelection bid for Governor. But in the same election, the newly convoluted map helped Gerry’s party win the senate – even though the party’s candidates lost the overall vote. The Federalist Party won the statewide vote total for the senate with 51,766 votes, defeating Gerry’s Democratic-Republicans, who pulled in 50,164 votes. But due to the way Gerry’s party had strategically scissored up the districts, it won 29 senate seats to just 11 for the Federalists.
This political event set the precedent for the electoral game-playing that has ever since created questions and doubts about whether voters’ choices are truly being represented in our state legislatures and the U.S. Congress. A political cartoon that appeared in the Boston Gazette on March 26, 1812, depicted the ridiculous shape of the new congressional district of South Essex County, MA. Its resemblance to a salamander immortalized Elbridge Gerry in a way he never could have imagined. Two hundred years later, state political parties are still gerrymandering and bending state legislative and U.S. Congressional districts to their electoral advantage. We will bump into Mr. Gerry once again before we are finished talking about the House.
At its core, gerrymandering is simply one party’s strategic plan to waste as many of its opponents’ votes as possible – in an effort to win as many legislative seats as possible. The practice has become so sophisticated that is now has its own lingo for describing how districts get fixed. Politicians can “pack” all the opposing party’s voters into a single district so that a ton of those votes get wasted (since the winner only needs over 50% of the vote total). At the same time they can engineer a district to include a strong majority of voters from their own party, while the rest sadly become known as “filler people.” Legislators can also “crack” or break up problematic voting groups into different districts, diluting their power. They can even “hijack” a district by reconfiguring the lines to force two incumbent officeholders from the same party to face-off against each other.
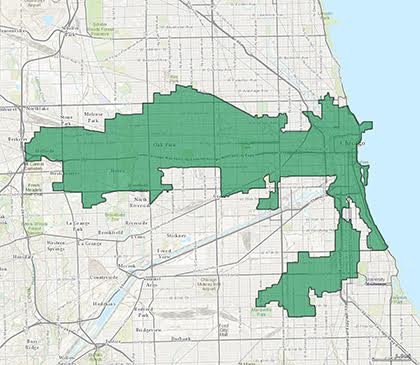
To be clear, both Democrats and Republicans gerrymander congressional districts to enhance their hold on elections and political power. In Illinois, after the 2010 Census, Democrats in charge of the state government masterfully gerrymandered new congressional districts. In the elections under the old map in 2010, Republicans had captured 11 seats while the Democrats had won eight. In the 2012 elections under the new map, the Democrats, although pulling in just over a majority (54%) of the overall vote, won twice as many seats as Republicans: 12 to six. In fact, if you take a look below at the shapes of the 4th and 7th Congressional Districts in Illinois, it’s not hard to see why in 2012 the National Journal named them the fourth and fifth most gerrymandered districts in the country.
In late 2012, near the end of his last term in Congress, Rep. Steven LaTourette (R-OH) described the rigging in this fashion: “Some candidates don’t even have to wake up on Election Day to win. I have not seen yet a redistricting proposal that is anything other than trying to favor one side over the other.”
But LaTourette knows full well that his own party is guilty, too. In fact, nationwide in 2012, the newly gerrymandered districts helped Republicans to clean the Democrats’ clock in congressional seat victory. We’ll get to those numbers shortly.
We know that gerrymandering has been going on for hundreds of years, but only over the last few decades have we seen a substantial debate about its negative effects. There is a popular perception that the gerrymandering of districts forces congressional candidates to stretch ideologically further to the right and the left to win their party’s nomination in primary elections. This theory also holds that these candidates who go on to win general elections and head to Congress are more stubbornly extreme once they arrive, due to the hardline primary races they’ve had to run to win the base vote in their gerrymandered districts.
There are many political journalists, as well as officeholders – in each party – who subscribe to this rationale. During the shutdown in 2013 forced by the House Republican Majority’s refusal to fund the government, U.S. Representative Scott Riggell (R-VA) called gerrymandering “the principal cause of gridlock in Washington” – and vowed reform. A week later, former U.S. Senator Judd Gregg (R-NH) was more specific: “The House of Representatives is locked down ideologically because it’s become stratified by gerrymandering of districts, so very little compromise is capable there.” Many of Gregg’s colleagues from across the aisle, among them Senator Chuck Schumer (D-NY) and former Senate Majority Leader George Mitchell (D-ME), echo these sentiments. And in 2014, former Supreme Court Justice John Paul Stevens not only expressed his belief that gerrymandering caused the shutdown – he proposed a Constitutional Amendment to render the practice illegal.
The irony is that even though many incumbent officeholders blame gerrymandering – and their own party’s use of it – as the cause of increased polarization in Washington, research has shown that its effects on the fierce partisanship in Congress may be overstated. The fact is that our country has been becoming more and more politically divided along regional lines for decades – that “big sort.” One researcher who has been studying polarization for years is Nolan McCarty, a political scientist at Princeton University. And although his work has consistently shown that the rigging of districts is not largely responsible for congressional division, he nevertheless makes clear why he believes gerrymandering should be discontinued:
the practice of elected politicians drawing districts for themselves and their political allies is an invitation to overt corruption. A key to any successful democracy is a widespread belief in the fairness and impartiality of elections. Having incumbents participate in designing districts promoting their job security does little to enhance the legitimacy of American democracy.
McCarty’s emphasis on fairness and trust in the system is particularly important in light of recent analyses of gerrymandering’s true effect: the distortion of American vote totals. To get a full grasp of this, we return to the Republican success in the 2012 election cycle – a process that actually started years in advance.
Prior to the 2010 redistricting (federal law requires states to redraw congressional every ten years to reflect new U.S. population figures), the Republicans crafted an official plan called “The Redistricting Majority Project” (REDMAP). In REDMAP’s own summary report, the project proudly explained how it saw an opportunity and took advantage of it:
As the 2010 Census approached, the RSLC began planning for the subsequent election cycle, formulating a strategy to keep or win Republican control of state legislatures with the largest impact on congressional redistricting as a result of reapportionment. That effort, the REDistricting MAjority Project (REDMAP), focused critical resources on legislative chambers in states projected to gain or lose congressional seats in 2011 based on Census data.
The party executed the plan with great skill. In 2010 the Republicans beat the Democrats badly in state elections, resulting in their increased control of state legislatures from 14 to 25 – and the privilege of scribbling new districts in most of them.
Of course, these efforts don’t happen magically – and certainly not for free. This is one way in which the problem of rigging races reaches back and overlaps with our first defect in the D.C. 4-3 – the money flood. REDMAP spent more than $30 million to run this project to gerrymander the districts. A ProPublica investigation summarized the pay-to-play this way: “it’s not cheap, and that’s where corporations and other outside interests come in. They can provide the cash for voter data, mapping consultants and lobbyists to influence state legislators, who are in charge of redistricting in most states.”
So what’s the bottom-line result from all of this spending and strategic drawing? We already know that in 2012 that the R’s won the majority of seats, 234-201, even as the D’s earned 1.4 million more votes. These are screwy results, to be sure – but just how much of the mismatch is due to gerrymandering? We do know that gerrymandering makes a difference. After all, in the states where Republicans drew the lines, their candidates won 72% of the seats with just 53% of the vote. Likewise, in the smaller number of states where Democrats had the power over redistricting, they won 71% of the races with 56% support. Still, these stats don’t take into account the “structural factors” that impact congressional districts, including our already polarized map, the power of incumbency, and also the high concentrations of Democratic voters in urban areas.
Fortunately, two mathematical analyses that were conducted following the election provide us more convincing answers. Sam Wang is a professor of molecular biology and neuroscience and founder of the Princeton Election Consortium. Wang points out that in 2012, gerrymandered districts in five states in particular were huge drivers of the overall backwards results (see chart).
Then Wang used computer models to split the 2012 state popular votes into thousands of unbiased, “differently selected districts.” This time the results came back right side up. In heavily gerrymandered Pennsylvania, for instance, Wang ran 1,000 simulations that changed the 13-5 seat split to 10-8. Nationwide, the 234-201 Republican advantage moved to a more representative split, 222-213. In the state simulations, as well as nationally, the Republicans still held control, but the distributions were at least closer to the actual vote. Wang explains the Pennsylvania example:
In this case, the structural imbalance is 9-8.3=0.7 seats. Partisan gerrymandering added a further imbalance of 8.3-5=3.3 seats. In other words, gerrymandering’s contribution to Pennsylvania’s partisan outcome was about five times as large as the effect of overall structural advantages.
Wang’s method measures “partisan bias” – the correlation of the overall vote to the share of seats won. Some critics have said that this is too general a standard, including the frequent swing vote on the Supreme Court, Anthony Kennedy.
In response to this, in 2014 two researchers devised a new formula for measuring the effects of gerrymandering that may settle the matter – as well as assist in future efforts to draw districts more fairly where there is the will to do so. Nick Stephanopoulos and Eric McGhee are legal scholars who argue in a study in the Chicago Law Review that the “efficiency gap” metric they’ve devised is far more effective in judging “the harm that is caused by gerrymandering” – for both the courts and the mapmakers.
Unlike “partisan bias,” which measures the difference “in the share of seats that each party would win given the same share of the statewide vote,” the efficiency gap actually measures the votes that are wasted. Stephanopoulos and McGhee explain the efficiency gap this way: “It aggregates all of a plan’s cracking and packing choices into a single number… the difference between the parties’ respective wasted votes is divided by the total number of votes cast, thus generating an easily interpretable percentage.”
By doing this, Stephanopoulos and McGhee can use that percentage – that one number – and compare it with redistricting plans from past decades. And that’s just what they did. In 2012, they found that the average efficiency gap across all redistricting plans was 1.58 – higher than any set of plans going back 40 years. In their words: “The severity of today’s gerrymandering is therefore historically unprecedented.”
This picture of gerrymandering and its effects are meaningful in the context of examining the rigging of elections. Debates continue over the level of impact it has on the hyper-partisan political environment on Capitol Hill. But let’s be clear – it isn’t helping. And the harm that we do know it causes in terms of distorting our American votes, and eroding our trust in the system, are unacceptable realities that cry out for reform.
(More on the PROBLEMS driving congressional dysfunction and a sensible PLATFORM for reforming the system are covered in the new book: Unlock Congress)